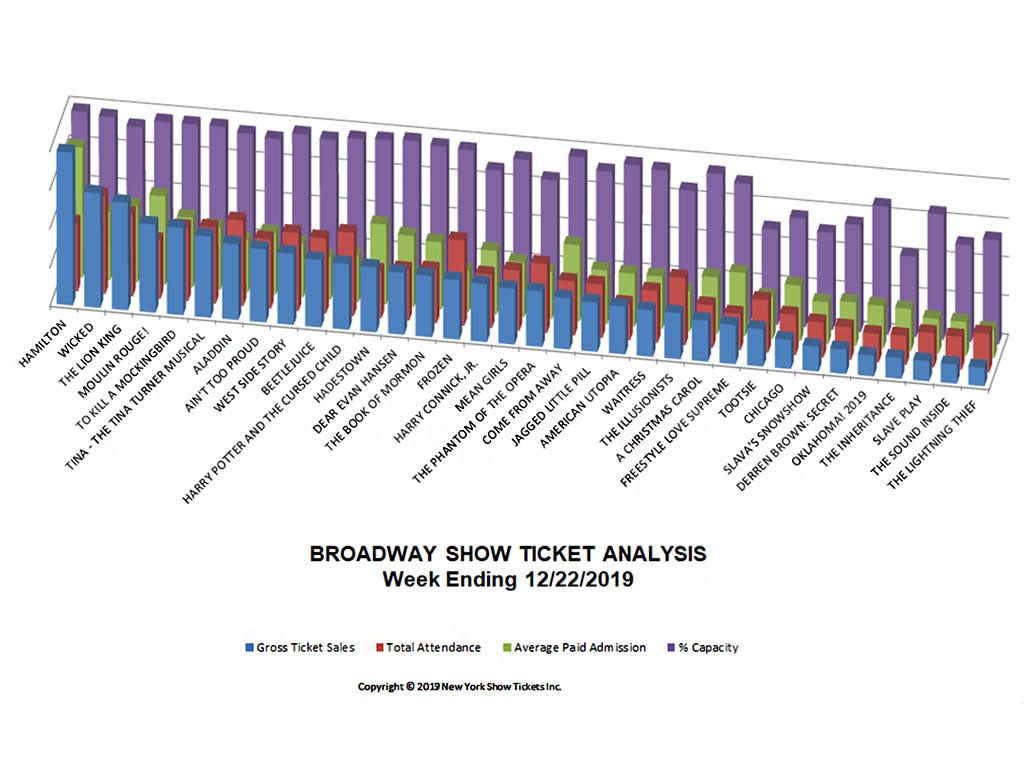
Broadway Show Ticket Sales Analysis Chart w/e 12/22/2019 - Seasonal Holiday Shows Boost Sales - Broadway Revival Second Week Previews. The minimum ticket price stayed the same.

| # | Show Name | Gross | TotalAttn | %Capacity | AvgPdAdm |
| 24 | A CHRISTMAS CAROL | $860,126 | 6,645 | 98.00% | $129.44 |
| 8 | AIN'T TOO PROUD | $1,532,603 | 10,842 | 95.00% | $141.36 |
| 7 | ALADDIN | $1,591,398 | 13,377 | 97.00% | $118.97 |
| 21 | AMERICAN UTOPIA | $1,001,491 | 5,722 | 99.00% | $120.91 |
| 10 | BEETLEJUICE | $1,417,445 | 11,723 | 98.00% | $97.15 |
| 27 | CHICAGO | $610,476 | 6,284 | 73.00% | $127.21 |
| 19 | COME FROM AWAY | $1,075,840 | 8,457 | 101.00% | $175.02 |
| 13 | DEAR EVAN HANSEN | $1,300,019 | 7,992 | 102.00% | $162.66 |
| 29 | DERREN BROWN: SECRET | $511,425 | 5,110 | 72.00% | $100.08 |
| 25 | FREESTYLE LOVE SUPREME | $819,609 | 5,663 | 93.00% | $144.73 |
| 15 | FROZEN | $1,250,664 | 13,320 | 99.00% | $93.89 |
| 12 | HADESTOWN | $1,361,078 | 7,429 | 101.00% | $183.21 |
| 1 | HAMILTON | $3,203,616 | 10,755 | 102.00% | $297.87 |
| 16 | HARRY CONNICK, JR. | $1,215,363 | 8,381 | 87.00% | $145.01 |
| 11 | HARRY POTTER AND THE CURSED CHILD | $1,383,980 | 12,976 | 100.00% | $106.66 |
| 20 | JAGGED LITTLE PILL | $1,032,100 | 8,387 | 93.00% | $123.06 |
| 17 | MEAN GIRLS | $1,169,220 | 9,362 | 96.00% | $124.89 |
| 4 | MOULIN ROUGE! | $1,850,983 | 9,114 | 100.00% | $203.09 |
| 30 | OKLAHOMA! | $436,851 | 4,476 | 86.00% | $97.60 |
| 28 | SLAVA'S SNOWSHOW | $519,535 | 5,496 | 65.00% | $94.53 |
| 32 | SLAVE PLAY | $422,282 | 5,355 | 84.00% | $78.86 |
| 14 | THE BOOK OF MORMON | $1,283,044 | 8,357 | 100.00% | $153.53 |
| 23 | THE ILLUSIONISTS | $963,419 | 10,513 | 85.00% | $91.64 |
| 31 | THE INHERITANCE | $435,154 | 4,548 | 54.00% | $95.68 |
| 34 | THE LIGHTNING THIEF | $386,730 | 5,981 | 70.00% | $64.66 |
| 3 | THE LION KING | $2,254,345 | 12,878 | 95.00% | $175.05 |
| 18 | THE PHANTOM OF THE OPERA | $1,166,763 | 10,799 | 84.00% | $108.04 |
| 33 | THE SOUND INSIDE | $400,572 | 5,153 | 65.00% | $77.74 |
| 6 | TINA - THE TINA TURNER MUSICAL | $1,701,255 | 11,861 | 100.00% | $143.43 |
| 5 | TO KILL A MOCKINGBIRD | $1,832,306 | 11,517 | 100.00% | $159.10 |
| 26 | TOOTSIE | $782,541 | 8,189 | 64.00% | $95.56 |
| 22 | WAITRESS | $974,404 | 8,122 | 97.00% | $119.97 |
| 9 | WEST SIDE STORY | $1,497,319 | 12,180 | 100.00% | $122.93 |
| 2 | WICKED | $2,401,820 | 15,408 | 100.00% | $155.88 |
| TOTALS | $40,645,776 Dollars | 302,372 People |
This Week on Broadway: w/e 12/22/2019
Wrapping up the week before Christmas, Broadway ticket sales were up. Gross ticket sales were slightly over $40.5 Million this week, which is a 4.3% increase week over week, this continues this upward Broadway holiday season ticket sales trend that the Great White Way has been seeing. When compared with the same week last season, this week's sales saw a slight dip of about 0.9% in gross ticket sales. This difference is insignificant when looking at the bigger Broadway ticket sales picture.
Seasonal Holiday Shows Boost Sales
There were three seasonal Broadway holiday shows that were taken into account during this past sales week including; The Illusionists: Magic of the Holidays (2019), A Christmas Carol and Slava's Snowshow. Each of them saw gross sales revenues go up between 4.51% and 20.25%. These three Broadway shows lead the way, for attendance which neared 25,000 tickets sold and made up for over 8% of the total butts-in-seats last week.
Broadway Revival Second Week Previews
West Side Story, the Broadway revival, performed its second week in-previews and saw a massive sales increase of over 19.3% from the previous performance week. The show again hit its max capacity, selling 12,180 total tickets for an average price of $122.93 per ticket, which is only $2.77 more than the previous weeks average price for the show.
The minimum ticket price stayed the same at, $37 but the max ticket price did increase significantly to, $448, an increase of $75. West Side Story was able to significantly increase their gross sales while not increasing the price for their cheaper seats, only increasing the prices for their high-end seats. They were also able to see high ticket sales even though the show only held seven performances this week, when typically Broadway shows host eight shows every week.
The Broadway show ticket analysis raw data has been provided courtesy of The Broadway League and has been collated and analyzed by the New York Show Tickets data team. All data, text, opinion, charts and commentary are copyright © 2019 nytix.com


